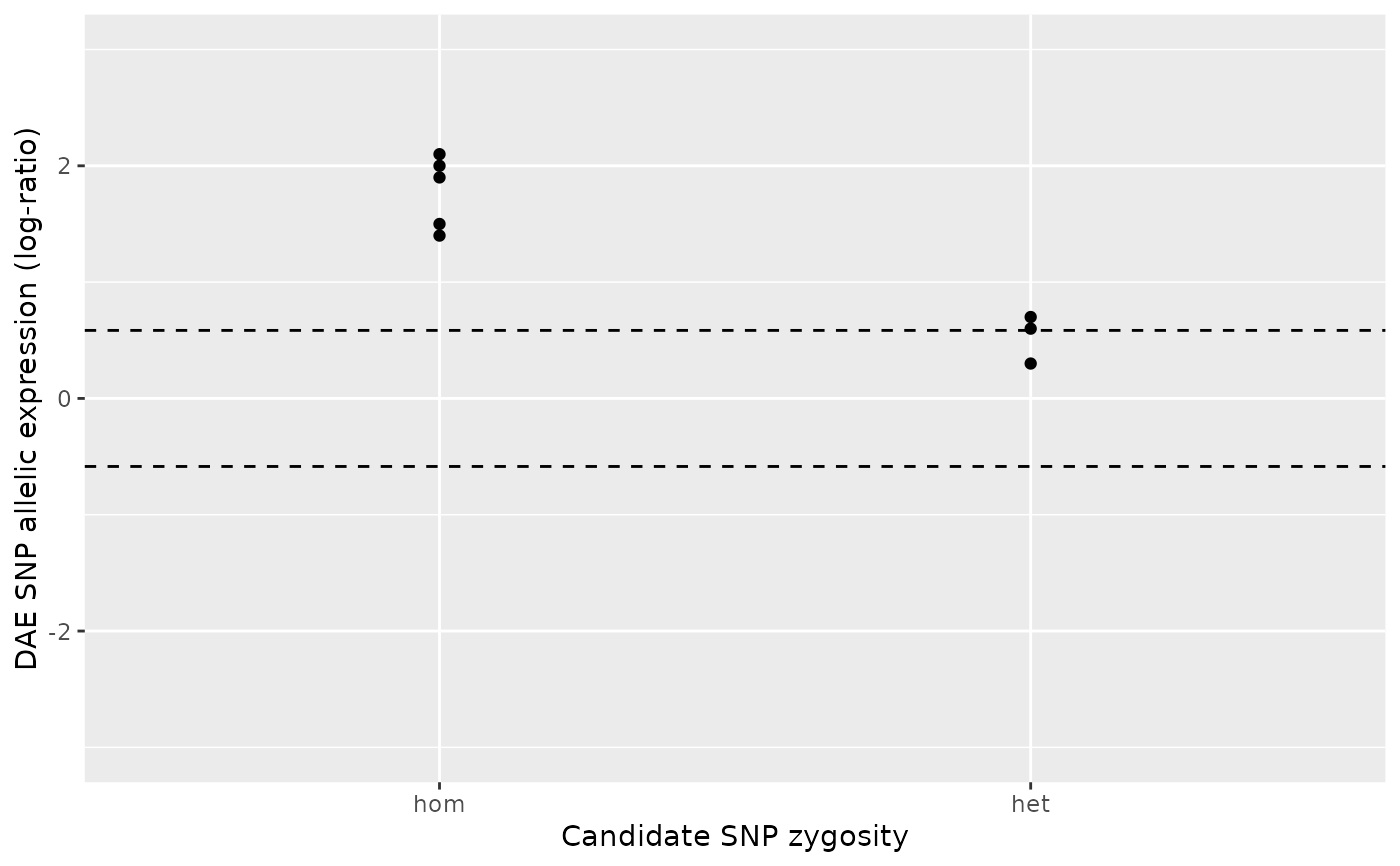
A simple wrapper around a ggplot2 plot showing allelic expression ratios for two groups of samples: homozygous and heterozygous. This is a handy function to quickly inspect the data underlying each DAEQTL mapping test.
Usage
daeqtl_plot(
  ae_hom,
  ae_het,
  dae_threshold = log2(1.5),
  min_n_hom = 2L,
  min_n_het = 2L,
  dae_threshold_linetype = "dashed",
  xlab = "Candidate SNP zygosity",
  ylab = "DAE SNP allelic expression (log-ratio)",
  ylim = NULL
)
Arguments
- ae_hom
Numeric vector of AE ratios of the DAE SNP. Each element of the vector refers to a sample that is homozygous (
hom) for the candidate SNP.- ae_het
Numeric vector of AE ratios of the DAE SNP. Each element of the vector refers to a sample that is heterozygous (
het) for the candidate SNP.- dae_threshold
An allelic expression (AE) threshold (in log-scale). A sample showing an absolute AE greater than
dae_thresholdis considered "technically" differential allelic expressed, meaning that the imbalance observed is not below the limit of detection. Adjustment made to this parameter should depend on the experimental assay sensitivity.- min_n_hom
Minimum number of samples in the homozygous group to be considered eligible for statistical testing.
- min_n_het
Minimum number of samples in the heterozygous group to be considered eligible for statistical testing.
- dae_threshold_linetype
Line type for the DAE threshold. See Line type for options.
- xlab
Title of the x-axis.
- ylab
Title of the y-axis.
- ylim
A two element vector specifying the y-axis limits.